The Dyslexia Learning App was created for the Dyslexia Learning Center in Nigeria, a non-profit organization dedicated to helping students with dyslexia in the community. The app focuses on improving cognitive function and reading abilities through intuitive and user-friendly design. It is a dual-sided platform, one side catered to students and the other catered to educators.
This project aimed to create a low-fidelity MVP (minimum viable product) for usability testing. My team’s goal was to design an intuitive, educator-friendly platform to help teachers better track the progress of students with dyslexia and implement a prototype tailored to real classroom needs.
Undefined pain points: Limited data from UXR required us to make educated assumptions and conduct independent research.
Delays in the design process: Partnerships were declined, delaying both research and design efforts.
Disorganization from Phase 1: Leadership changes led to a gap of nearly a year, requiring a complete overhaul of deliverables.
Ambiguity in teacher workflows: Lack of clarity on what data would be most beneficial for educators.
Tracked down what information was viable from Phase 1
Overhauled disorganized deliverables from Phase 1 due to lack of justifiable documentation.
Learned to keep the data clean and document justifications clearly as we go for design decisions moving forward.
Divvied up design roles
Sketches and initial wireframes for login and onboarding screens, dashboard, and students tabs, ensuring a streamlined experience for teachers.
Meeting with stakeholder where we asked clarifying questions for more direction
Collaborated with UXR to add more direction for design by refining educator-focused questions, such as:
What data is critical for teachers?
How should information be displayed to avoid overwhelming users?
User flow working session
Collaborated with Product Strategy to better understand users and define their needs using user stories
Refined low-fidelity wireframes based on feedback left by my team members
Defined navigation patterns and sidebar functionality.
Aligned with UXD-Team B to ensure consistent language across educator and student interfaces to prevent confusion (e.g., 'Assignments' vs. 'Games').
Collaboration with UXR - Created tasks and scenarios for usability testing, focusing on:
Information architecture.
Navigation flow.
Interaction design.
Use cases/usefulness
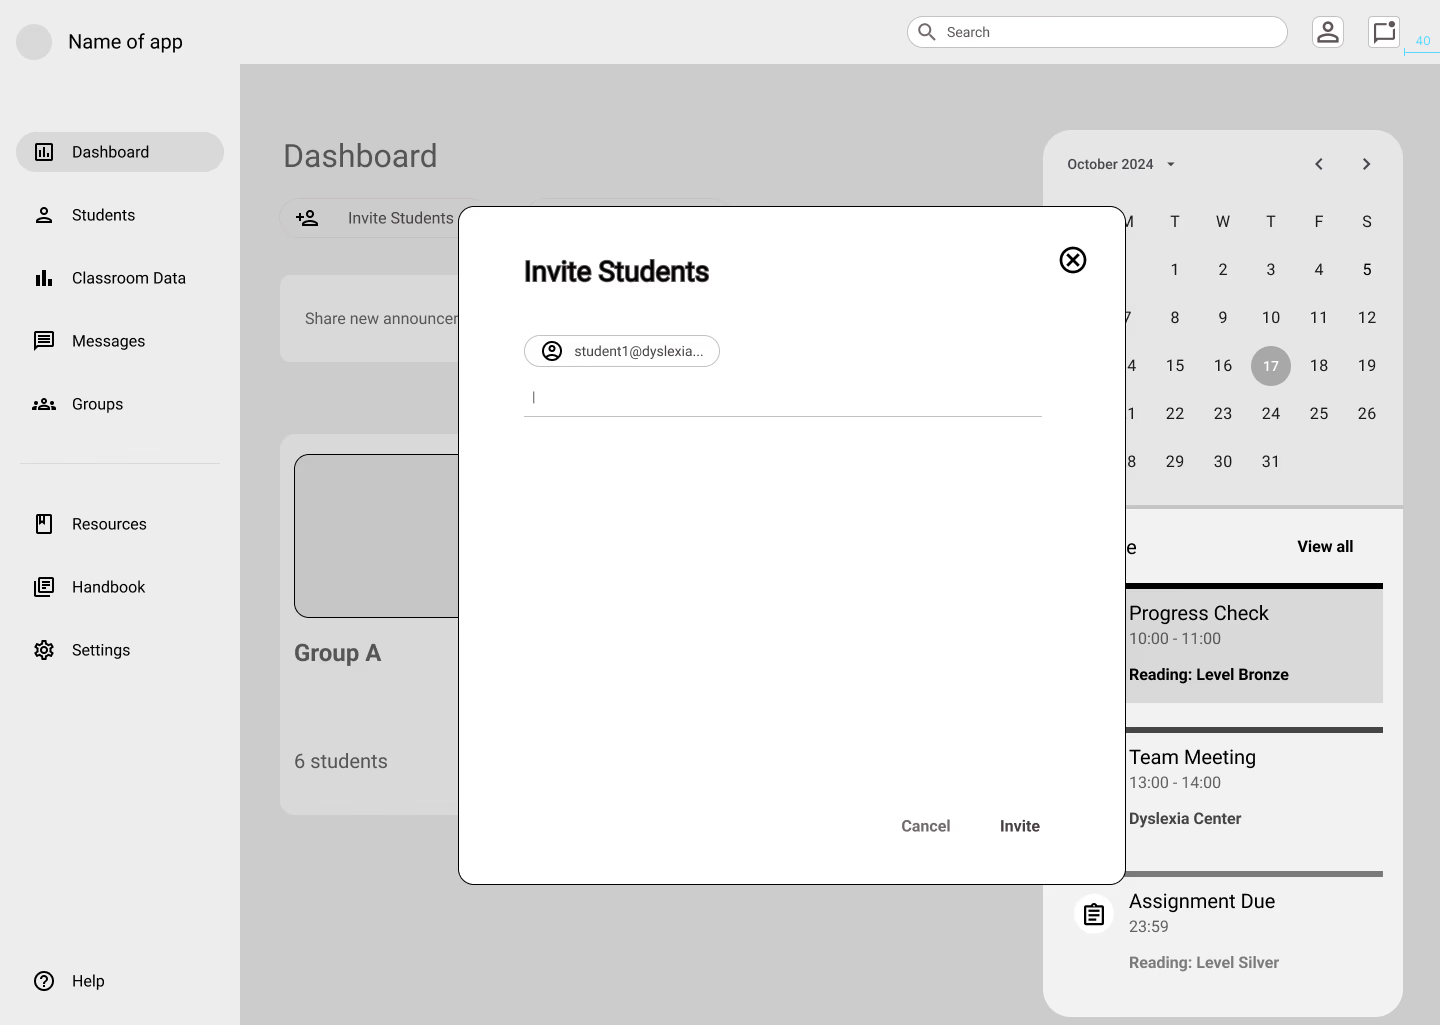
Added a user flow / journey for inviting students to a course
Finalized low-fi wireframes for key screens.
Aligned with UXD-Team B to ensure consistent language across educator and student interfaces to prevent confusion (e.g., 'Assignments' vs. 'Games').
Collaboration with UXR - Created tasks and scenarios for usability testing, focusing on:
Information architecture.
Navigation flow.
Interaction design.
Use cases/usefulness
Added a user flow / journey for inviting students to a course
Finalized low-fi wireframes for key screens.
Our process was divided into four 2-week sprints, each planning our goals to accomplish, addressing key challenges, and moving us closer to a functional prototype.
Our process was divided into four 2-week sprints, each planning our goals to accomplish, addressing key challenges, and moving us closer to a functional prototype.
The Dyslexia Learning App provided educators with an intuitive way to:
Monitor student progress without being overwhelmed by data.
Streamline classroom management through tailored dashboards.
Reduce stigmas with data-driven, positive insights highlighting the program's impact and need within the Nigerian population.
Because of limited participation in UXR usability testing, user feedback was delayed and we did not receive results in time to be able to reiterate on designs before project deadline.
If I had more time this would be my interpretation of a high-fidelity design:
Because of limited participation in UXR usability testing, user feedback was delayed and we did not receive results in time to be able to reiterate on designs before project deadline.
If I had more time this would be my interpretation of a high-fidelity design:
Overview
Overview
Supporting Dyslexic Students: Designing an Educator Dashboard to Track Progress and Personalize Learning
Supporting Dyslexic Students: Designing an Educator Dashboard to Track Progress and Personalize Learning
Problem Statement
Problem Statement
Role
Role
Goals
Goals
Research & Exploration
Research & Exploration
Challenges
Challenges
Reflection & Next Steps
Reflection & Next Steps
Impact
Impact
High-fidelity Design
High-fidelity Design
Sprint 1: Establishing Foundations
Sprint 1: Establishing Foundations
Design process
Design process
Sprint 2: User Flow and Collaboration
Sprint 2: User Flow and Collaboration
Sprint 4: Prototype and Handoff
Sprint 4: Prototype and Handoff
Sprint 3: Usability Testing Preparation
Sprint 3: Usability Testing Preparation


Navigation
To streamline our design process, a navigation sidebar & top bar was created to ensure consistency throughout the team workflow. Within the sidebar, educators are able to:
Access the dashboard (center hub)
View their student groups
Seek help via the help icon
Quick and easy access to view all notifications
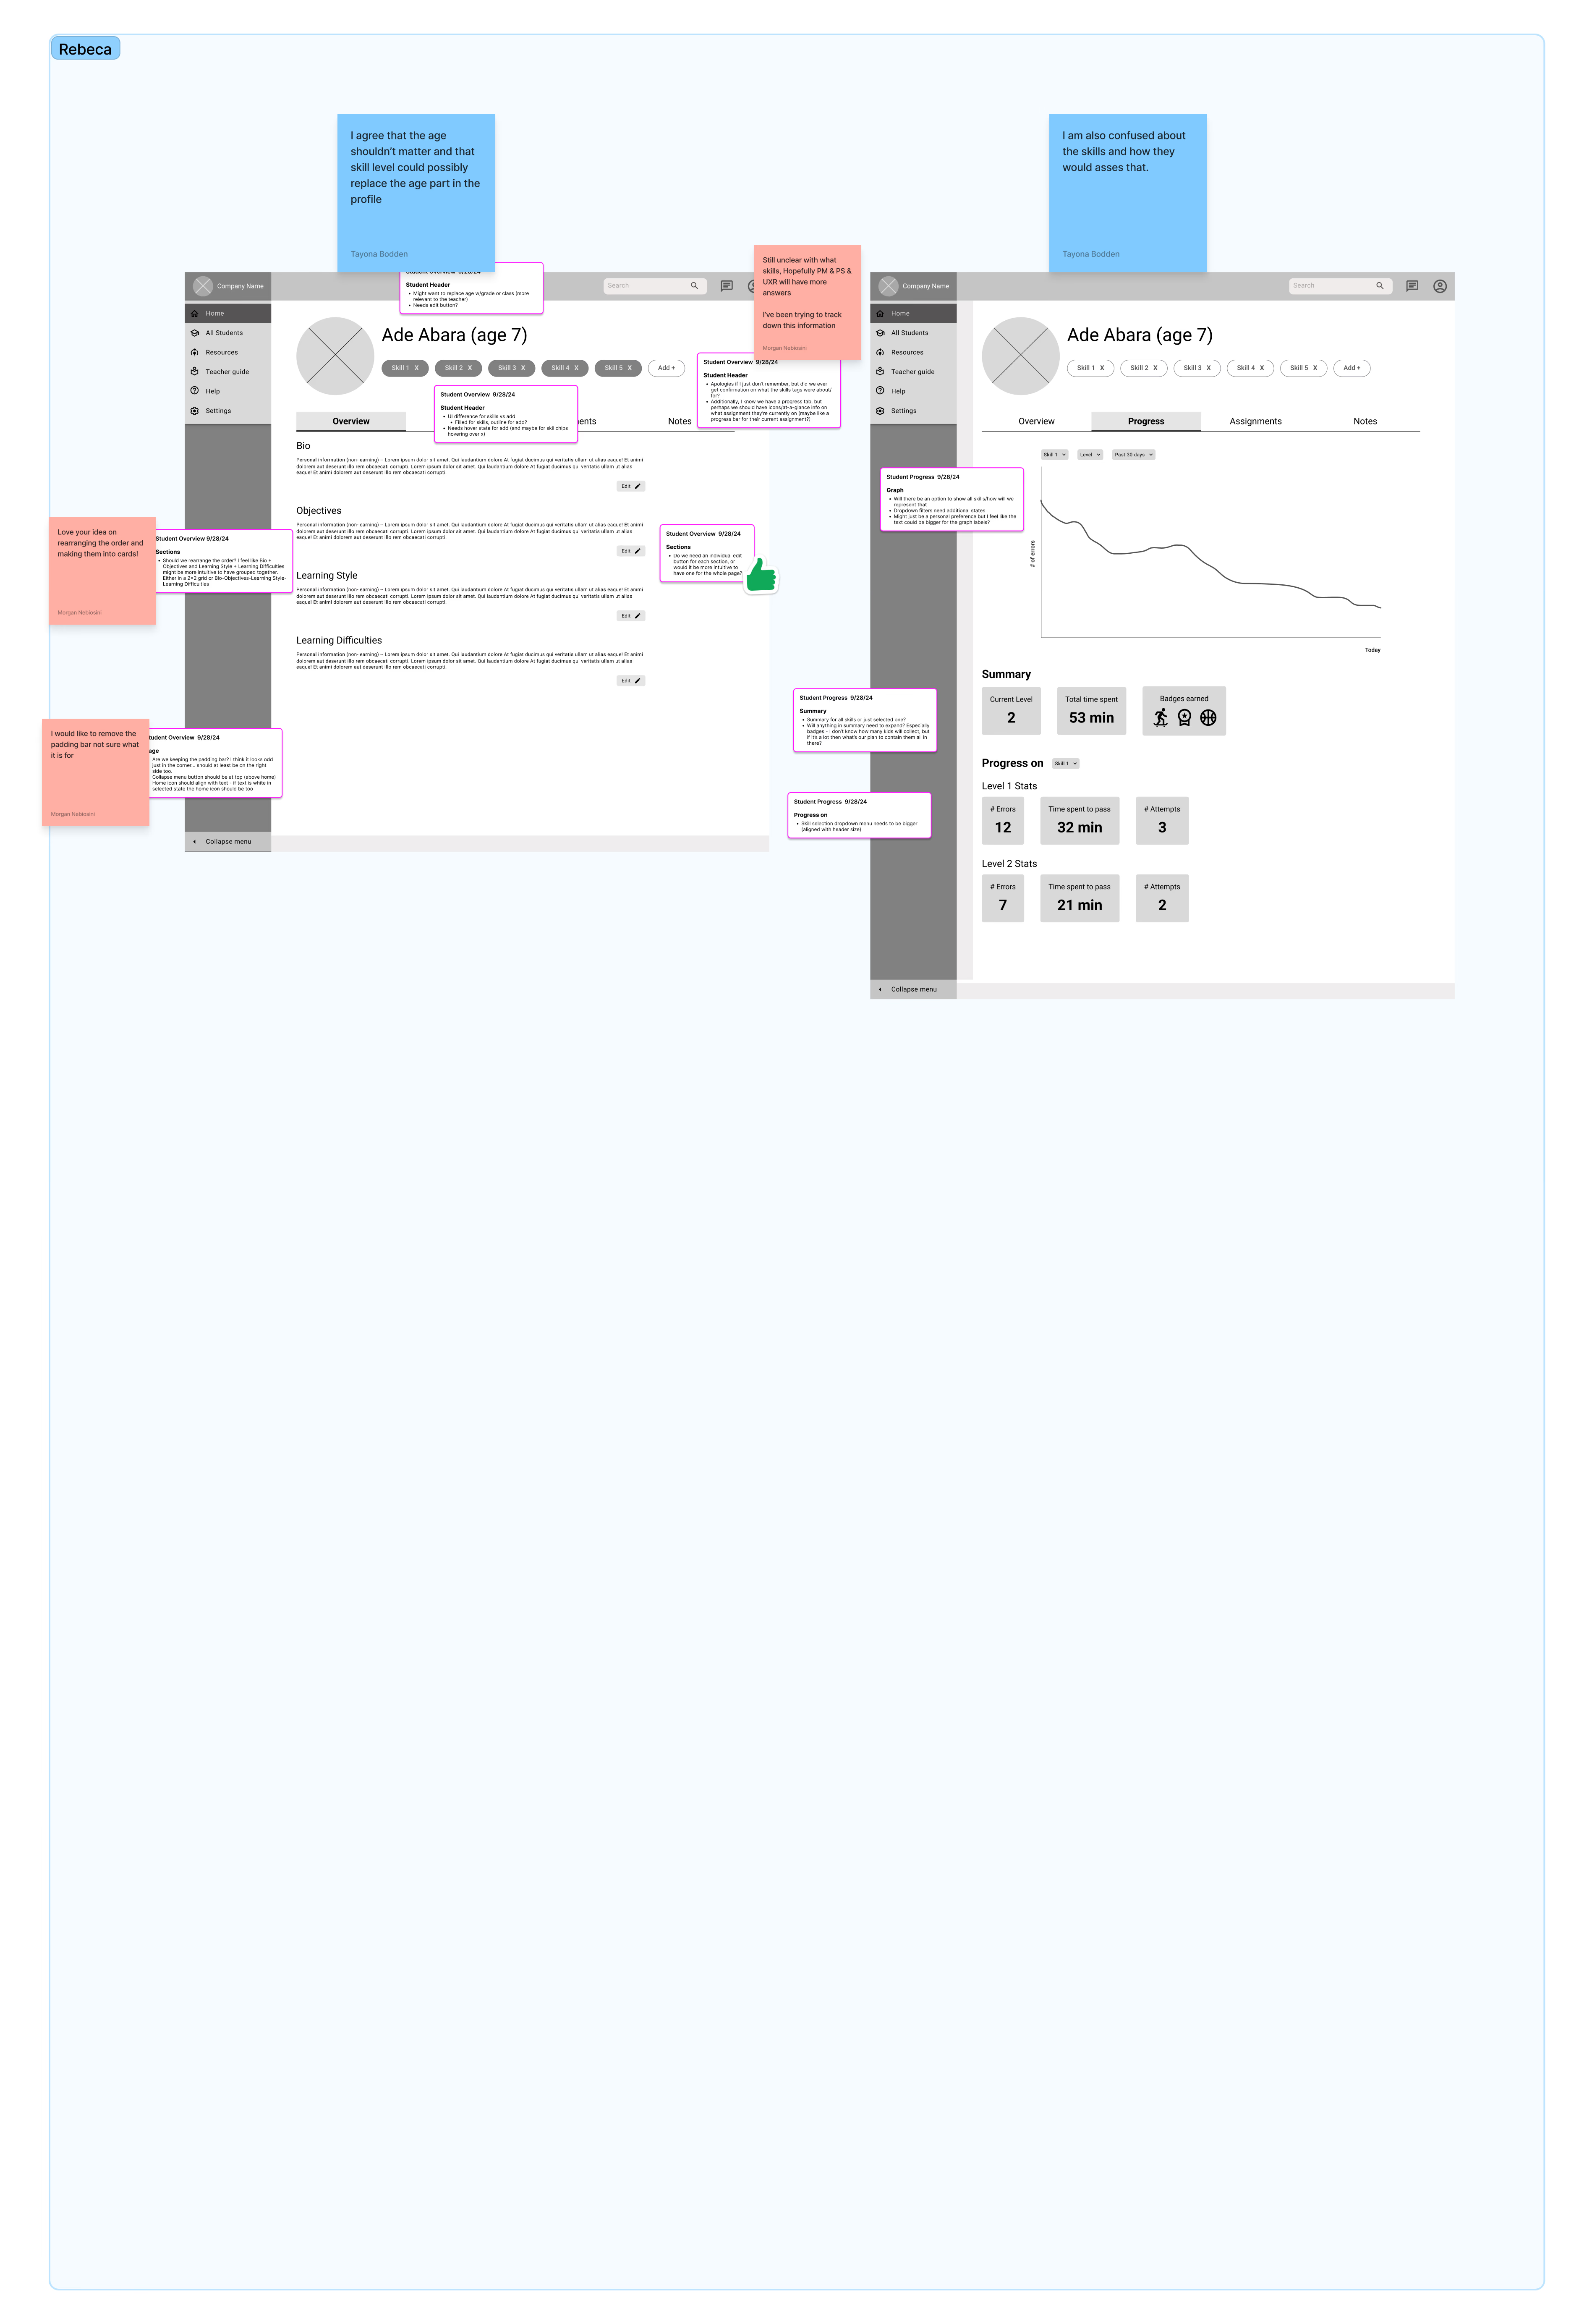
Low-fidelity prototype
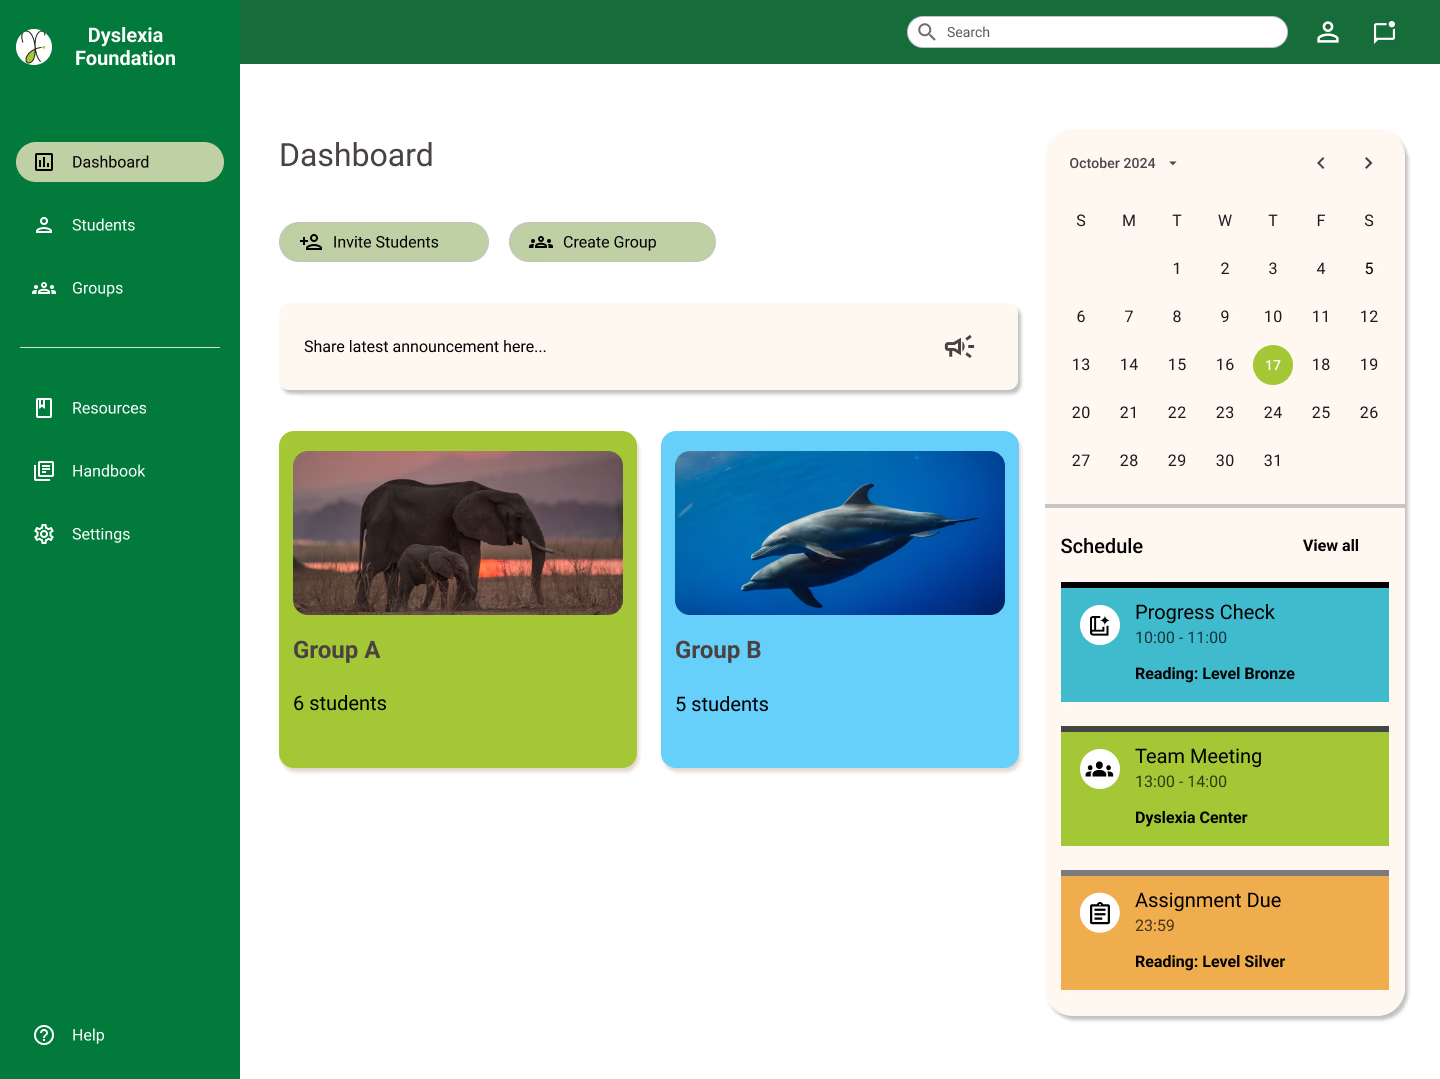
Main educator dashboard
Main educator and course dashboards
Course dashboard
Initial wireframes for onboarding, student profile, and dashboards.
Reflection and Lessons Learned
Collaboration is key: Regular working sessions and open communication across teams ensured alignment and cohesion.
Working through ambiguity and working with other teams to come to solutions
Working sessions with team - we did a great job discussing and combining ideas
Having great PMs or Design Team Leads makes a big difference
Adaptability matters: Overcoming disorganization and data limitations required creative problem-solving and flexibility.
Rapid ideation and brainstorming multiple solutions helped us navigate ambiguity and identify the best approaches. And pivot easily by throwing out and being open to many solutions
Next Steps:
Incorporate feedback from usability testing to refine designs further.
Transition to high-fidelity designs for final development.
Explore partnerships to enhance data integration.
This project was a valuable experience in designing for inclusivity and innovation, and I look forward to further iterations that make education more accessible for all.
How might we support teachers working with students with dyslexia?
How do we dismantle the stigma around dyslexia in education?
How might we support teachers working with students with dyslexia?
How do we dismantle the stigma around dyslexia in education?
My Team:
2 UXD Leads
3 apprentices (including myself)
My Role : Apprentice
My Team:
2 UXD Leads
3 apprentices (including myself)
My Role : Apprentice
Teams:
UXD - A (educator) - My Team
UXD-B (student)
UXR
PS
UXW
Dev (solution architects)
Teams:
UXD - A (educator) - My Team
UXD-B (student)
UXR
PS
UXW
Dev (solution architects)
To address the lack of initial data, we:
Conducted a competitive audit of other educator resource platforms like Google Classroom and Canvas.
Analyzed dashboard designs for inspiration and insights.
Collaborated with UXR to ask questions that uncovered educators' key needs and challenges to help us better empathize with our users.


User flow session
Held a user flow collaboration session from dashboard to define information architecture.
User flow session
Held a user flow collaboration session from dashboard to define information architecture.
Dashboard
Designed a dual-dashboard structure for educators and courses:
Educator Dashboard: Centralized hub for creating courses, managing students, and sharing announcements.
Course Dashboard: Displays class-specific progress, participation metrics, and visual cues for students requiring additional support.
Built a functional prototype ready for UXR usability testing.
Prototype collab session with team - connecting screens together, running prototype, and catching bugs in sequence
Collaborated with UXW team to ensure clear, concise, and supportive language throughout the interface.
Updated the design system and UI kit to ensure seamless transition into Phase 3.
Presented the MVP to stakeholders through a screen-recorded walkthrough or click-through while talking.
Organized documentation for Phase 3 hand-off.

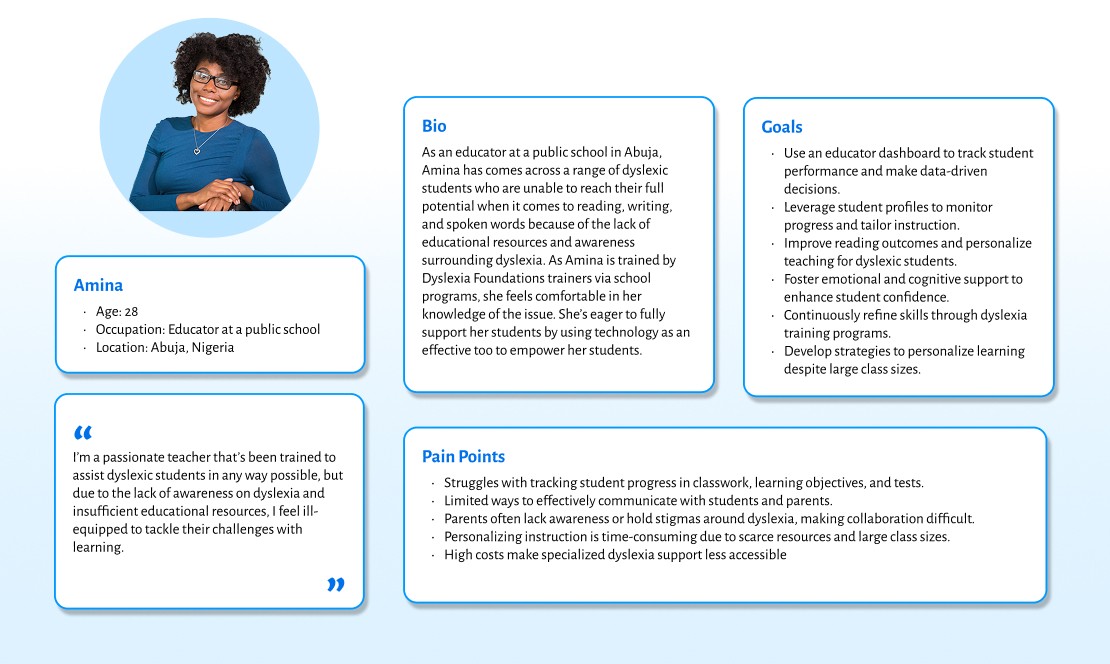
User persona
Design a functional, low-fidelity MVP that prioritizes usability for educators while addressing their specific needs.
The app will feature:
student progress tracking, and individualized learning roadmaps,
an onboarding process that highlights educational resources and economic incentives for supporting dyslexic students.

Invite student user flow
Hi-fi main educator dashboard and course dashboard


Designing an Educator Dashboard to Track & Personalize Learning for Dyslexic Students
🎯 UX Apprentice | Team: 2 UX Leads, 3 Apprentices
📌 Collaborated with UXR, Product Strategy, UX Writing, and Dev teams.
A dashboard for educators to track student progress and personalize learning for students with dyslexia. Designed for the Dyslexia Learning Center, a nonprofit in Nigeria.
❓ How might we help teachers support students with dyslexia?
❓ How do we dismantle stigma in education?
Design a low-fidelity MVP for usability testing.
✔️ Create an intuitive educator dashboard with:
Student progress tracking + individualized learning roadmaps.
Onboarding with resources + economic incentives for educators.
⚠️ Limited UXR data → Required independent research.
⚠️ Delays from leadership changes → Overhaul of Phase 1.
⚠️ Unclear teacher workflows → Needed structured data visualization.
🔹 Reorganized Phase 1 work for clarity.
🔹 Sketched login, onboarding, and dashboard wireframes.
🔹 Defined team roles & documentation best practices.
Initial wireframes for onboarding, student profile, and dashboards.
Main educator dashboard and course dashboard
Invite student user flow
Navigation tools
🔹 Asked educators: What data matters most?
🔹 Designed dual dashboards:
Educator Dashboard: Manage courses, students & announcements.
Course Dashboard: Track participation & student progress.
🔹 Created navigation patterns for consistency.
🔹 Asked educators: What data matters most?
🔹 Designed dual dashboards:
Educator Dashboard: Manage courses, students & announcements.
Course Dashboard: Track participation & student progress.
🔹 Created navigation patterns for consistency.
🔹 Collaborated with UXD-Student team for UI consistency.
🔹 Defined key testing areas: Navigation, IA, & interaction design.
🔹 Designed student invite flow & finalized wireframes.
🔹 Built interactive prototype for usability testing.
🔹 Aligned UX writing for clarity.
🔹 Updated design system for smooth Phase 3 transition.
🔹 Presented MVP to stakeholders.
⚠️ Usability testing results were delayed and we could not reiterate on designs before the project deadline.
If I had more time this would be my interpretation of a high-fidelity design:
Link to low-fi prototype
✅ Simplified progress tracking for educators.
✅ Streamlined classroom management with clear dashboards.
✅ Reduced stigma through data-driven insights.
💡 Collaboration is key → Working sessions kept teams aligned.
💡 Adaptability matters → Pivoting quickly improved outcomes.
💡 Strong leadership helps → Good PMs & UX Leads make a difference.
🔹 Integrate usability testing feedback.
🔹 Develop high-fidelity designs.
🔹 Secure partnerships for better data integration.
This project strengthened my skills in designing for accessibility & real-world impact. 🚀
Overview
My Role
Problem Statement
Goals
Challenges
Design Process
Sprint 1: Laying the Foundation
Sprint 2: User Flows & Structure
Sprint 3: Usability Testing Prep
Sprint 4: Prototype & Handoff
High-fidelity Design
Low-fidelity Prototype
Impact
Lessons Learned
Next Steps

Hi-fi main educator dashboard and course dashboard
"Sagon yn lantīr bona ao ūndegon jorrāelza."


"Sagon yn lantīr bona ao ūndegon jorrāelza."
"Sagon yn lantīr bona ao ūndegon jorrāelza."